
The use of floodways in floodplains may be considered as an alternative to the construction of bridges. Floodways are relatively long, lowered, reinforced road sections that allow the controlled overflow of floodwater during the flood season. They are common in several countries. Compared to bridges and culverts, floodways have a number of advantages and disadvantages that should be taken into consideration (see Table 1 below).
This annex provides guidance on the choice of a floodway as an alternative to other options (Section 1) and the main design considerations while constructing them (Section 2). This section was prepared by making extensive use of the Floodway Design Guide (2006) by MRWA Waterways Section and BG&E Pty Ltd., one of the exceptional references on this engineering option.
Table 1. Advantages and disadvantages of floodways
| Floodways: Advantages | Floodways: Disadvantages |
| Maintain (wetland) functions of the floodplains | Cause road downtime: the road will not be motorable during high flood levels |
| Ensure controlled, well-directed areas of overflow: these can be wetlands or recharge areas | |
| Allow roads in floodplains to have lower embankments, thus saving costs | |
| Cost less than bridges | |
1. Considerations in the development of floodways
Floodways are constructed on drainage paths of floodplains that carry water during the flooding period but that are dry in other parts of the year. Rather than building a bridge for the occasional flood, a floodway may be considered a more economical and ecologically sensitive option.
Floodways have a number of advantages related to costs, the preservation of wetland functions, and the ability to control flooding. Their main disadvantage is that during high flood levels it is not possible to pass through them. Planning and constructing a floodway requires a good understanding of the topography of the relevant section of the floodplain, the flood patterns, and the minimum service level of the road.
Understanding the local topography of the floodplain
The following are typical minimum requirements to understand the topography of the floodplain:
- A cross-section across the river, extending beyond the water level for the discharge being considered. Cross-sections upstream and downstream of the proposed structure are also required.
- A long section (profile) along the streambed, including the water-surface profile if available, in order to estimate the hydraulic gradient of the drainage path.
- A long section (profile) on the road centerline if an existing road is being analyzed.
Understanding flooding patterns
To understand flooding patterns, it is necessary to know the typical development of flood levels over time and the frequency of floods.
Flood hydrographs are needed to evaluate floodway safety and serviceability during times when floods overtop the road at different heights. Flood hydrographs also support the evaluation of whether a river section has sufficient surcharge storage and/or dedicated flood-control space.
Probabilistic extreme flood hydrographs can be developed to assess the reservoir flood/surcharge space to temporarily store a portion of the flood volume and to attenuate or pass the hydrograph peak without overtopping the floodway.
Deciding on road-service levels
While planning a floodway it is important to determine how much road downtime is acceptable. Taking into consideration car axle heights, the interaction between car tires and road surface, and the lateral pressure against the side of the cars, cars operate safely through flows up to 365 mm deep under ideal conditions. Under real conditions, because of the presence of debris, potholes, and waves, a depth of 230 mm is more appropriate. In recent years, cars have become lighter, so a critical depth of 200 mm is best used as the motorable limit for cars. Thus, the road is closed to traffic when the critical depth of flow over the floodway crossing exceeds 200 mm. For heavy vehicles, the maximum motorable critical depth is 500 mm.
Serviceability is then related to the acceptable closure time of the road connection. Decisions on acceptable downtime may also be influenced by the importance of the road as an access in emergency situations.
The duration of closure can be calculated by drawing a horizontal line on an average hydrograph at the discharge level corresponding to the 200 mm level and measuring the time for which the flow is above this level. Roads will be off-limits for light vehicles if the total head (static plus velocity) on a roadway with a two-way crossfall or across the highest edge of a roadway with a one-way crossfall exceeds 200 mm. The height of the floodway above the stream may be adjusted to accommodate the requirement of motorability/passability.
2. Design considerations
The following are the main considerations in designing floodways:
- Deciding on the dimensions of the floodways (2.1);
- Deciding on the road surface (2.2); and
- Deciding on the armoring of the floodways and other scouring protection measures (2.3).
2.1 Deciding on the dimensions of the floodway
Floodways are constructed in the lowest part of the floodplain. The dimensions (width and height) of the floodway should be chosen to ensure that floodwater spreads widely across it. This should bring flow velocity down to acceptable levels (reducing scour) and ensure that the level of the water passing over the waterway during the flooding period is in line with the accepted downtime (see above). If fish migration is expected to occur across the floodway during times of flood, then a check should be done on allowable flow velocities.
In the design of a floodway, hydraulic analysis is required for a number of reasons:
- To estimate stage and tailwater levels for various flows;
- To determine the backwater caused by the floodway;
- To estimate the closure time during flood events; and
- To calculate the velocities at the floodway.
Where a floodway is used together with a bridge or major culvert, the hydraulic analysis should take all these structures into account.
Natural section discharge
For the natural section, Manning’s formula for open channel flow is typically used to determine the stage-discharge curve:
![]()
![]()
Values for the Manning roughness coefficient ‘n’ should be assessed onsite. Alternatively, tables may be used to determine its value. Natural sections of the floodplain are usually irregular. A roughness coefficient is selected for each part of the stream cross-section. For natural sections, it is preferable for the hydraulic gradient ‘S’ of the stream to be estimated from the water-surface profile.
Stage and tailwater levels
The stage is defined as the water level at the floodway or structure on the natural section for the design flow. It is the water level in a scenario that assumes no structures present at the crossing and is typically taken at the road centerline.
The tailwater level is the water level downstream of the structure. It is similar to the stage level but is taken at the outlet of the floodway. The outlet is generally only a few meters downstream of the road centerline. The hydraulic gradient is typically very small; there is often little difference between the stage and tailwater levels. The same value can be used for both levels.
The capacity, discharge and velocities at the floodway can be estimated using Manning’s equation. To calculate the capacity of floodways, different widths and heights may be assumed to arrive at floodway dimensions that are practical and financially/economically acceptable.
The discharge over the floodways can be determined using the “Submergence Factor Curve”:
- For design discharge, obtain the tailwater level and the mean flow velocity, V, approaching the flow channel, from an open channel analysis (Manning’s equation).
- Select a crest level (linked to flood hydrograph and serviceability criteria) and the length of the flood channel, L. Assume the water height, h, above the crest of the flood channel.
Calculate H/l
Where: H = total head (static plus velocity) = h+(V2/2g)
With: H/l and obtain free-flow coefficient of discharge, Cf. Should the value of H/l be less than 0.15, Cf should be read from curve “Discharge Coefficients for Floodways”.
If there is submergence (e.g., if D/H>0.76), calculate the percentage of submergence D/H x 100 and read off the submergence factor Cs/Cf.
Calculate discharge (m3/s) over the floodway using the broad-crested weir formula:
![]()
![]()
If there is submergence, check whether the discharge over the floodway matches the design discharge. If it does not, adjust the depth of flow above floodway crest, h, and repeat the procedure. Alternatively, the floodway crest level or length can be adjusted.
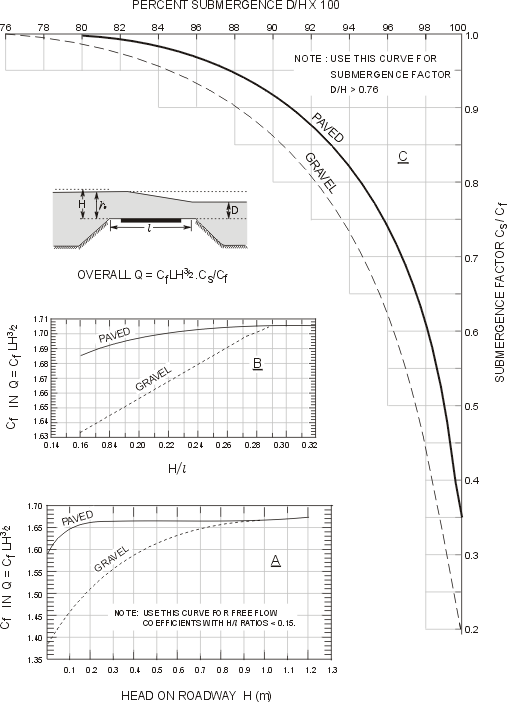
Simplified until step, 6, assume that Cf with H/l is a constant value of 1.69 outfall conditions (unsubmerged). The simplified equation is shown below:
![]()
![]()
Backwater and upstream flooding
Upstream assets that cannot cope with increased flood levels will typically necessitate a higher-capacity floodway structure to minimize backwater effects.
Culverts on the floodway
In designing a floodway, the use of drainage culverts may be considered. These culverts may serve one or more of the following functions:
- Reducing backwater effects;
- Raising the tailwater level and reducing the head through the flow channel;
- Facilitating drainage and avoiding stagnation behind the embankment; and/or
- Facilitating drainage and avoiding the overflow of smaller and more frequent flows.
2.2 Deciding on the road surface
In designing a floodway, a decision must be taken on the length of floodway, its width and pavement characteristics.
Length
The length of a floodway should be limited to 300 m. If the floodway is longer, drivers may become disoriented when confronted with wide, open stretches of water.
Pavement
Two types of pavement are generally used in floodways:
- Stabilized base course: This is used for floodways in areas where periods of inundation are relatively short (less than 30 hours per year) and in areas without heavy traffic during submerged conditions.
- Concrete pavement: This is typically used where periods of inundation are long and the road is subject to heavy traffic during wet conditions.
Horizontal alignment
Floodways should be located on straight stretches and not on horizontal curves. Curves cause problems in defining the edge of the pavement. The water depth will be deeper on one side of the road than on the other, affecting passability and creating safety problems.
Floodways should be designed with a horizontal longitudinal profile so that the depth of water over the road is as uniform as possible over the flooded section.
Signaling
Floodways should have a warning sign. Depending on the depth of the flood, an indication of the road route and depths at different points on the road should be provided. Barrier rails and other barriers are a significant obstruction to flow over the avenue channel and should be avoided, but sticks may be used.
2.3 Deciding on armoring and scour protection of a floodway
Scour protection works are an important element in floodway design. The floodway sections that are prone to scouring are (in order of severity):
- Toe of the downstream batter slope
- Surface of the downstream batter slope
- Edge of the downstream shoulders
- Road surface
- Upstream batter slope
The causes of scouring at these positions are:
- The impact of overflowing flood water at supercritical velocity at the toe of the downstream batter slope
- The drag/shear resistance on the batter slope
- The uplift force caused by embankment geometry
- The drag/shear resistance on the running surface
- The effect of approach velocity
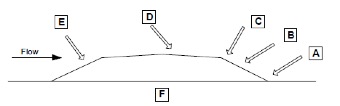
Scouring below the floodway can also cause failure (F). This scour is caused either by piping or riverbed instability due to sediment transport.
The first consideration in protecting the floodway from scouring concerns the choice of the armoring material. There are several options, the suitability of which depends on the availability of material, rock protection, and the likely flow velocity and potential scouring over the floodway. These options include:
- Concrete protection;
- Cutoff walls (end walls);
- Rock fills below the embankment;
- Cement-stabilized batter slope/embankment fill;
- Cement-stabilized subgrade/base course; and
- Two-coat bituminous seal.
To determine the level of protection required or the type of pavement to be used, the maximum flow velocity at various sections on the embankment cross-section needs to be calculated.
The peak velocity on the pavement (Vp) will always occur at the downstream edge just before submergence (supercritical regime).
During a low-tailwater condition, the flow will accelerate down the batter until one of three things happen:
- It reaches a steady-state velocity. Under these conditions the maximum velocity attained by the flow occurs above the tailwater surface and equals the steady-state velocity.
- It penetrates the tailwater surface while still accelerating. Under these conditions the maximum velocity obtained by the flow occurs at the tailwater surface and will be less than that described by Manning’s equation.
- It reaches the natural surface and remains supercritical until a hydraulic jump occurs further downstream. (Observations made in the field have shown that this does not usually occur and thus this condition will not be further considered here).
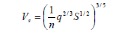
The steady-state velocity of flow on a slope (Vs) may be calculated from Manning’s equation. Values of Manning’s ‘n’ will vary: 0.012 for a batter protected with concrete slab and up to 0.06 for dumped rock.
Table 2. Values of Manning’s ‘n’
| Pavement/Batter Protection | Manning’s ‘n’ |
| Bitumen Seal | 0.013-0.016 |
| Concrete | 0.012 |
| Grass | 0.030 |
| Rock Mattress | 0.050 |
| Dumped Rock: Facing Class | 0.055 |
| Light Class | 0.055 |
| ¼ ton | 0.060 |
| ½ ton | 0.060 |
| 1 ton | 0.060 |
Manning’s equation:
A flow with an upstream head H above the crown and that is known to have a steady-state velocity (Vs) on the batter will achieve this steady state at a vertical distance ∆p below the crown, such that
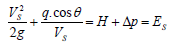
Maximum velocity on the batter (Vb) will occur when the flow reaches steady state at the tailwater level, that is, when ∆p. To simplify the analysis, flow on the batter is given by the simplified energy equation

Maximum batter velocity will occur at the transition discharge, when flow changes from plunging flow to surface flow. Vbo will be the lesser of Vs.
In this regime, we assume that the plunging flow will be decelerated below the shoulder level because of the high tailwater; thus we use ∆p = p – downstream shoulder level.
Equation (7)
Where:
Vm = the velocity of flow
K = a proportionality constant dependent upon the ratio ∆p/H and is given in Figure 4.6.
The maximum velocity (Vp) on the pavement occurs at the downstream shoulder at submergence.
The velocity of flow for any other discharge may be calculated using a similar procedure.
For a discharge greater than the submergence discharge, Vp may be approximated as q/D.
Other flow characteristics that may be useful to know are the critical velocity and critical depth at the crown of the road:


Note that these formulas are only valid for a free outfall type of flow, i.e. D/H < 0.76.
Additional measures
Several additional measures need to be considered to eliminate road damage due to scouring:
- Avoid the buildup of negative pressures caused by changes in flow direction. It is recommended that the shoulder be rounded with a radius of approximately 3.3 m.
- Use concrete slabs and pumping lining mattresses to make the surface and slopes impermeable.
- Construct spillways on the embankment and use drainage culverts to prevent pressure buildup.
- Avoid installing guardrails and posts near the shoulder downstream.
- Plant trees on the upstream and downstream batter of the floodway to reduce the velocity of the water flowing over the floodway.
Embankment batter protection
Downstream protection of floodway embankment batter slopes may be flexible or rigid. All protection should sit easy with the road pavement at the shoulder to avoid high pressure resulting in sharp steps or grade changes. Examples of flexible and rigid protection are listed below.
Flexible Protection
- Riprap: graded rock/stone dumped on a prepared slope. Hand-placed graded rock, which is inferior to dumped rock, is seldom used today.
- Gabion mattresses/rock mattresses: rocks placed in wire baskets or on wire-covered mats.
- Flexible mats, individual small high-density concrete blocks, cast onto geotextile loop matting.
- Flexible pump-up revêtement mattresses: concrete-filled nylon mattresses in which the concrete flows into discrete segments that are largely independent once the concrete has set, providing a degree of flexibility.
- Vegetative cover can form an effective scour-protection system for floodways where the embankment and approach velocity are low.
Rigid Protection
- Grouted rock: dumped or hand placed with the voids filled with mass concrete.
- Rigid pump-up revêtement mattresses: nylon mattresses into which a small aggregate concrete is pumped.
- Concrete slab protection: plain or reinforced concrete slabs poured or placed on the surface to be protected.
Rigid protection is susceptible to undermining by scour. Combinations of flexible and rigid systems may also be considered.
The use of a concrete cutoff wall at the downstream shoulder is recommended when high flow velocities are expected.
A permeable geotextile filter should be placed between the embankment fill and the flexible scour protection. A graded sand/gravel filter may also be used for extra protection.
Design tables for dumped graded rock and gabion mattresses are provided below.
Table 3. Design of Rock Slope Protection
| Velocity (m/s) | Class of Rock Protection, Wc (tons) | Section Thickness, T (m) |
| <2 | None | — |
| 2.0-2.6 | Facing | 0.50 |
| 2.6-2.9 | Light | 0.75 |
| 2.9-3.9 | ¼ | 1.00 |
| 3.9-4.5 | ½ | 1.25 |
| 4.5-5.1 | 1.0 | 1.60 |
| 5.1-5.7 | 2.0 | 2.00 |
| 5.7-6.4 | 4.0 | 2.50 |
| >6.4 | Special | — |
Table 4. Standard Classes of Rock-Slope Protection
| Thickness (m) | Rock-Fill Size (mm) | D50 (mm) | Critical Velocity (m/s) | Limit Velocity (m/s) |
| 0.15-0.17 | 70-100 | 85 | 3.5 | 4.2 |
| 70-150 | 110 | 4.2 | 4.5 | |
| 0.23-0.25 | 70-100 | 85 | 3.6 | 5.5 |
| 70-150 | 120 | 4.5 | 6.1 | |
| 0.30 | 70-120 | 100 | 4.2 | 5.5 |
| 100-150 | 125 | 5.0 | 6.4 |
| Rock Class | Rock Size (m) | Rock mass (kg) | Minimum Percentage of Rock Larger Than |
| Facing | 0.40 | 100 | 0 |
| 0.30 | 35 | 50 | |
| 0.15 | 2.5 | 90 | |
| Light | 0.55 | 250 | 0 |
| 0.40 | 100 | 50 | |
| 0.20 | 10 | 90 | |
| ¼ tons | 0.75 | 500 | 0 |
| 0.55 | 250 | 50 | |
| 0.30 | 35 | 90 | |
| ½ tons | 0.90 | 1000 | 0 |
| 0.70 | 450 | 50 | |
| 0.40 | 100 | 90 | |
| 1 tons | 1.15 | 2000 | 0 |
| 0.90 | 1000 | 50 | |
| 0.55 | 250 | 90 | |
| 2 tons | 1.45 | 4000 | 0 |
| 1.15 | 2000 | 50 | |
| 0.75 | 500 | 90 | |
| 4 tons | 1.80 | 8000 | 0 |
| 1.45 | 4000 | 50 | |
| 0.90 | 1000 | 90 |